Post by ac6la on Mar 25, 2011 23:40:01 GMT -5
In recent versions of the AIM control program the "Smoothing" function is turned on by default. That is, Setup > Smoothing > Auto smoothing (2%) is the default configuration. Normally that is fine but be careful when doing a scan on a section of cable with an "extreme" termination such as an open or short circuit.
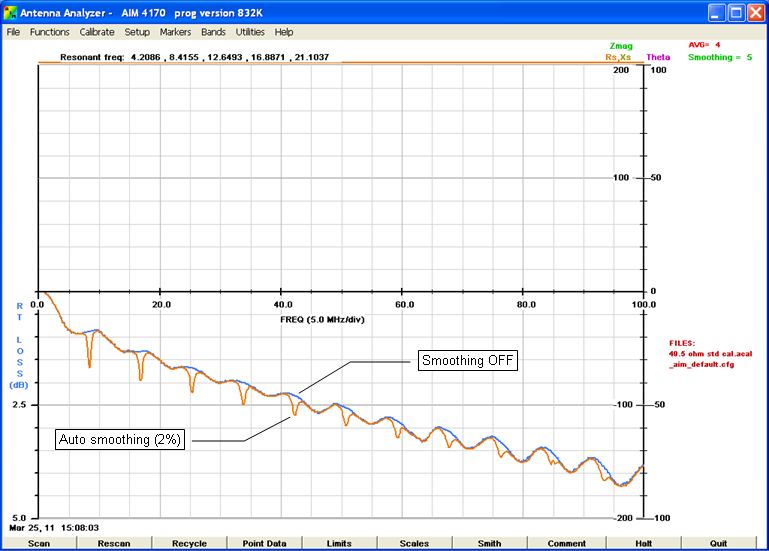
For example, here's a comparison of a scan from 1 to 100 MHz with 0.1 MHz steps on a length of RG-58 with an open circuit termination, first with "Smoothing OFF" followed by a rescan with "Auto smoothing (2%)". (Note that I changed the "Rescan" color for Return Loss from light blue to light red just to make the traces easier to distinguish.)

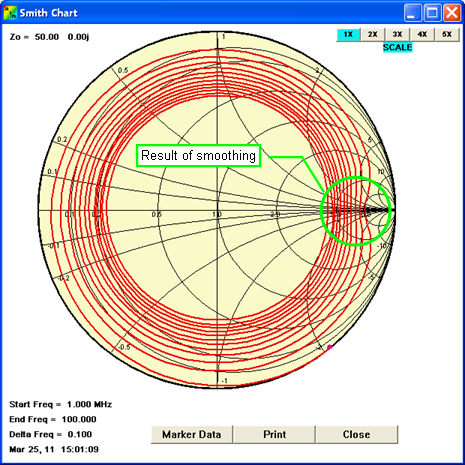
And here's what the Smith chart looks like with "Auto smoothing (2%)". Notice the "depressions" near the open circuit point (3:00 o'clock) on the chart.

You would see similar results if the termination had been a short circuit, namely "spikes" on the Return Loss plot and a "depression" of the Smith chart trace (except on the opposite side). The spikes will be more pronounced if the scan step size is larger and less pronounced if the step size is smaller.
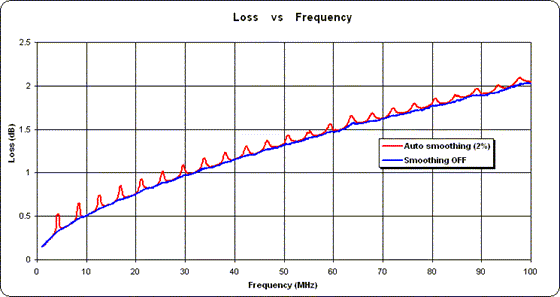
If you then use these "smoothed" open and short termination files with the Zplots "Measure TL Parms" function the results will look like this when you plot the calculated line loss.

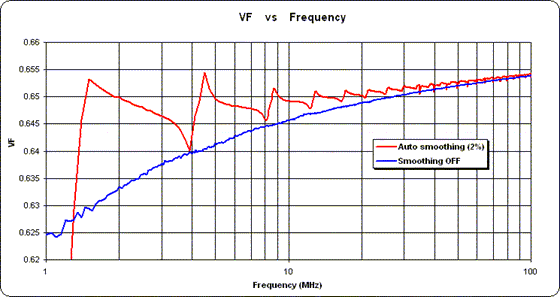
And like this for velocity factor (with a log frequency scale).

Again, the "spikes" in the (red) traces for loss and VF are due to the use of smoothing. So, depending on the type of measurements you are making and how you intend to use the data, you may wish to make "Smoothing OFF" the default AIM setting.
Dan
For example, here's a comparison of a scan from 1 to 100 MHz with 0.1 MHz steps on a length of RG-58 with an open circuit termination, first with "Smoothing OFF" followed by a rescan with "Auto smoothing (2%)". (Note that I changed the "Rescan" color for Return Loss from light blue to light red just to make the traces easier to distinguish.)

And here's what the Smith chart looks like with "Auto smoothing (2%)". Notice the "depressions" near the open circuit point (3:00 o'clock) on the chart.

You would see similar results if the termination had been a short circuit, namely "spikes" on the Return Loss plot and a "depression" of the Smith chart trace (except on the opposite side). The spikes will be more pronounced if the scan step size is larger and less pronounced if the step size is smaller.
If you then use these "smoothed" open and short termination files with the Zplots "Measure TL Parms" function the results will look like this when you plot the calculated line loss.

And like this for velocity factor (with a log frequency scale).

Again, the "spikes" in the (red) traces for loss and VF are due to the use of smoothing. So, depending on the type of measurements you are making and how you intend to use the data, you may wish to make "Smoothing OFF" the default AIM setting.
Dan

